Discovering Multirelational Structure In Social Media Streams
Publication Journal Article2012

Discovering multirelational structure in social media streams

Aisling Kelliher, Yu-Ru Lin, Hari Sundaram, Munmun De Choudhury

Abstract

In this article, we present a novel algorithm to discover multirelational structures from social media streams. A media item such as a photograph exists as part of a meaningful interrelationship among several attributes, including time, visual content, users, and actions. Discovery of such relational structures enables us to understand the semantics of human activity and has applications in content organization, recommendation algorithms, and exploratory social network analysis.We are proposing a novel nonnegative matrix factorization framework to characterize relational structures of group photo streams. The factorization incorporates image content features and contextual information. The idea is to consider a cluster as having similar relational patterns; each cluster consists of photos relating to similar content or context. Relations represent different aspects of the photo stream data, including visual content, associated tags, photo owners, and post times. The extracted structures minimize the mutual information of the predicted joint distribution. We also introduce a relational modularity function to determine the structure cost penalty, and hence determine the number of clusters. Extensive experiments on a large Flickr dataset suggest that our approach is able to extract meaningful relational patterns from group photo streams. We evaluate the utility of the discovered structures through a tag prediction task and through a user study. Our results show that our method based on relational structures, outperforms baseline methods, including feature and tag frequency based techniques, by 35%--420%. We have conducted a qualitative user study to evaluate the benefits of our framework in exploring group photo streams. The study indicates that users found the extracted clustering results clearly represent major themes in a group; the clustering results not only reflect how users describe the group data but often lead the users to discover the evolution of the group activity.

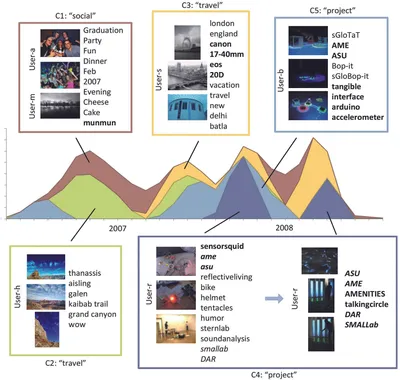
Fig. 4. This figure presents a case which results are recognized by the participants in our user study (see appendix). The 5-cluster results extracted from the “AME” group. We display representative photos, users (renamed for privacy consideration) and tags, as well as the temporal strength of each cluster over time. Based on participants’ feedback, we annotate the clusters as C1: “social,” C2: “travel,” C3: “travel,” C4: “project” and C5: “project.” Based on the photos uploaded by the group members, the clustering results capture interesting evolution of the activity in the local community. For example, social events (as in C1) were more frequently in 2007. Travel photos (as in C2 and C3) have been continuously uploaded by different users. Users started documenting their work in Fall 2007 (as in C4 and C5). C4 captures a fine-grained activity evolution; it represents that the project work involving user-r in different points of time are colocated (e.g. “smallab” and “DAR” in C4 are location names), but the project content are different.
How This Connects
Aisling KelliherAisling KelliherTaskville: visualizing tasks and raising awareness in the workplaceTaskville: visu…Identifying community resources using data mining, crowdsourcing, and networked co-curationIdentifying com…Design futures in action: Documenting experiential futures for participatory audiencesDesign futures …Tell Me a StoryTell Me a StoryNextSlidePlease: Authoring and delivering agile multimedia presentationsNextSlidePlease…Experiential Media and Digital CultureExperiential Me…Wind runners: designing a game to encourage medical adherence for children with asthmaWind runners: d…
Discovering multirelational structure in social media streams
1 PEOPLE
Open in Constellation View